What Is Data Visualization and Why Is It Beneficial?
Data visualization represents raw data through charts, maps, and graphics in order to quickly and easily derive insights from the data. In this way, data visualization tools can assist with a company’s decision-making process. Through data visualization tools, businesses easily recognize which KPIs (key performance indicators) require attention and adjust accordingly. Another benefit of data visualization is that it allows companies to tell a story through their data. Businesses can use data visualization tools to turn large data sets into easy-to-understand visuals that reveal unseen patterns and observations.
Comparing Data Visualization Tools
It is important to pick the right visualization tool for your business’s specific needs. Some popular visualization tools are Power BI, QlikView, Tableau, and Google Data Studio.
Power BI
Power BI is a product of Microsoft and therefore is more compatible with Windows users. Additionally, because it is a Microsoft product, it was designed to improve upon and expand the capabilities of MS Excel. There is a robust library of visuals to choose from and the platform is able to connect to almost any kind of data source (cloud-based or on-premise). Some of the drawbacks of Power BI are that it is primarily equipped to handle only small data sets and that it has limited access to other databases.
QlikView
Similar to Power BI, QlikView has an extensive library of visuals to utilize and is a good platform for creating intuitive, associative dashboards. Building reports can become difficult depending on how in-depth the report needs to be. However, QlikView has come out with a product called QlikSense that is designed to be more user-friendly with simpler visualizations. One of the benefits of QlikView is that it has advanced filtering options so that the user can directly target the variable or KPI that is most important to them.
Tableau
With Tableau, the visuals are dynamic, interactive, and insightful. Tableau is great for zeroing in on trends and distributions in the data set, and the outcome of the visualizations is clean and organized. Some distinctions of Tableau from other data visualization tools are that it is incredibly easy to share dashboards and reports with other users. Additionally, Tableau appeals to different levels of data visualization experience and is ideal for users who have large data sets from multiple data sources that they want to drill down on.
Google Data Studio
Although relatively newer than the previously mentioned software, Google Data Studio is staking its claim as an easy-to-navigate and intuitive platform amongst its competitors. The visualization setup is a simple drag and drop and the sharing function is similar to Google Drive. Data Studio is ideal for collaboration since multiple users can access and make changes in the dashboard simultaneously. The gallery in Data Studio also has ready-to-use templates for a quick-expression of data. Finally, one of the biggest advantages of Google Data Studio is that it is entirely free!
Google Data Studio and Corkboard Concepts
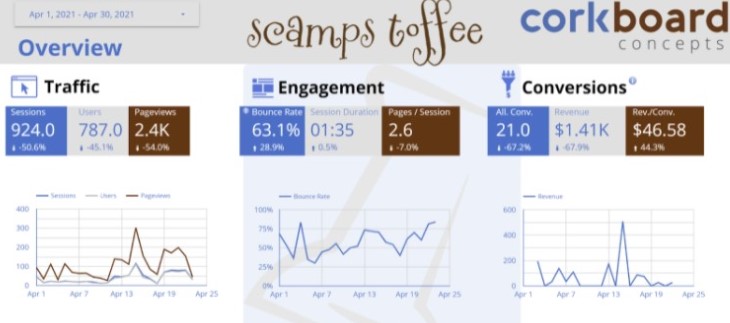
Because we are a Google Partner and predominantly utilize Google Platforms, Google Data Studio was the right data visualization tool for us. Corkboard Concepts is able to seamlessly integrate collected data from Google campaigns with Google Data Studio. This continuity allows us to share, with our clients, the success of our campaigns and marketing efforts. In other words, anything you can do in Google Ads, you can show in Data Studio.


